
The second part of the technical article on tuned pipes...
Read Part 1 HERE...
***This article is reprinted from the December 2006 NAMBA Propwash with permission from the author and NAMBA. The entire newsletter can be found at www.namba.com.
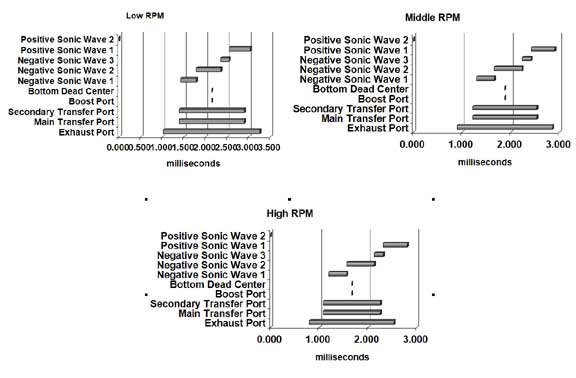
First a quick review of tuned pipe theory. The pipe produces two pressure waves at the exhaust port. The first, a low-pressure wave, is created by the diffuser section of the pipe when the exhaust port opens. It reaches its lowest pressure when the piston is at bottom dead center and helps draw fuel up through the transfers. The second wave is a high-pressure pulse created by the baffle cone that arrives just before the exhaust port closes and supercharges the cylinder. The picture below shows the timing of the pulses created by a multi cone diffuser and the baffle cone relative to the port open time. The baffle cone produces Positive Sonic Wave 1 and each section of the diffuser produces Negative Sonic Waves 1 through 3.
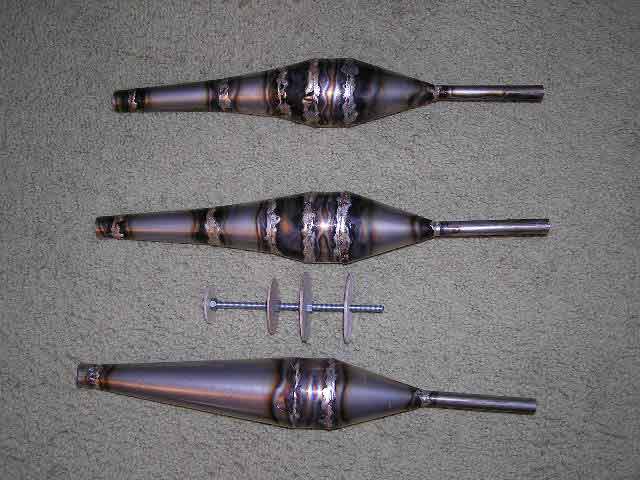
There are several types of diffuser in use. The simplest is a single cone that tapers up from the header diameter to the maximum pipe diameter. This has evolved into multi cone diffusers that look like a roughly shaped horn. These two styles are shown in the picture below. The top two pipes have multi cone diffusers on the left side of the maximum diameter section, while the bottom pipe has a straight cone diffuser. The top pipe’s diffuser has a higher horn coefficient than the second pipe. That is, it expands more suddenly then the diffuser section of the second pipe. All these pipes have the same maximum diameter, the same baffle cone and the same tuned length.
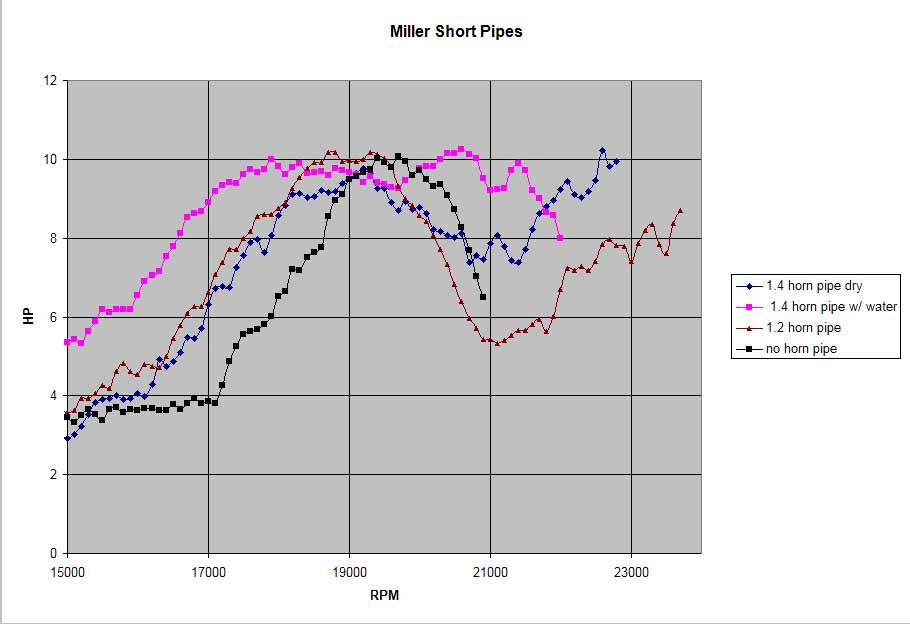
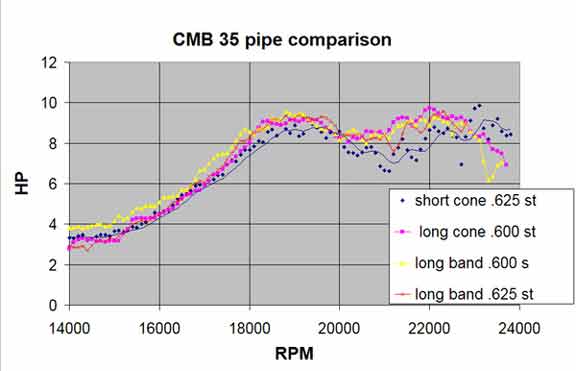
The tuned length of these pipes was designed to produce best power around 22,000 to 24,000 rpm, with the top pipe producing the lowest power and the bottom pipe producing the highest. The top pipe should have the broadest power band while the bottom pipe should have the narrowest. Below are the actual test results on a modified CMB 35. Nearly all the lines represent the average of two or more runs. Where there is scatter from a single run, an average line is drawn through the points.
The problem with the actual pipes on a real engine is that they produce two power peaks and the second peak is probably higher than 24,000 rpm. All the pipes turned out to be too short. This happened because I used the wrong average temperature in the pipe design program. The power band on the pipe with the straight cone diffuser is so narrow and the trough is so deep that the engine won’t rev much beyond the first peak. The pipe with the 1.2 horn coefficient diffuser looks like it has a narrower power band at the high rpm peak, but it’s hard to tell since the peak wasn’t reached. The pipe with the 1.4 horn coefficient might work as a high rpm pipe. It is interesting to see how water injection into the header of the 1.4 horn coefficient pipe affects the power. This cools the exhaust and is the same as making the pipe longer.
Two more pipes were made to a longer tuned length with the same diffuser section. The first was lengthened by lengthening the maximum diameter band section, and the second was lengthened by lengthening the baffle cone. The length to the stinger was kept the same on both pipes. A comparison of these pipes is shown on the graph below.
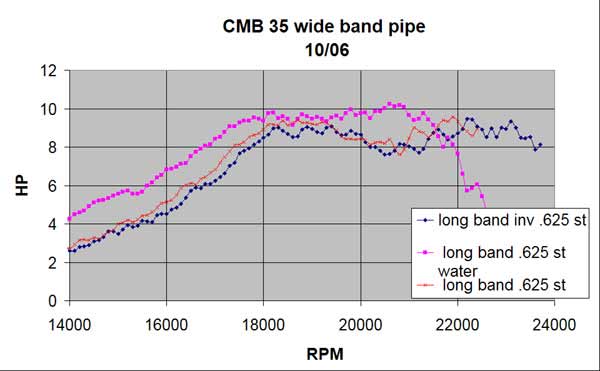
As you can see, there is very little difference even though the tests were run with both .600 and .625 diameter stingers. The dark blue line is a test on the shorter pipe tested before but with a larger stinger. It has lower power than the longer pipes except above 23,000 rpm. We have also reduced the trough in the power curve by adjusting the carburetor fuel delivery with the high and low range needles. Further testing on the wide band version of the longer pipes is shown below.
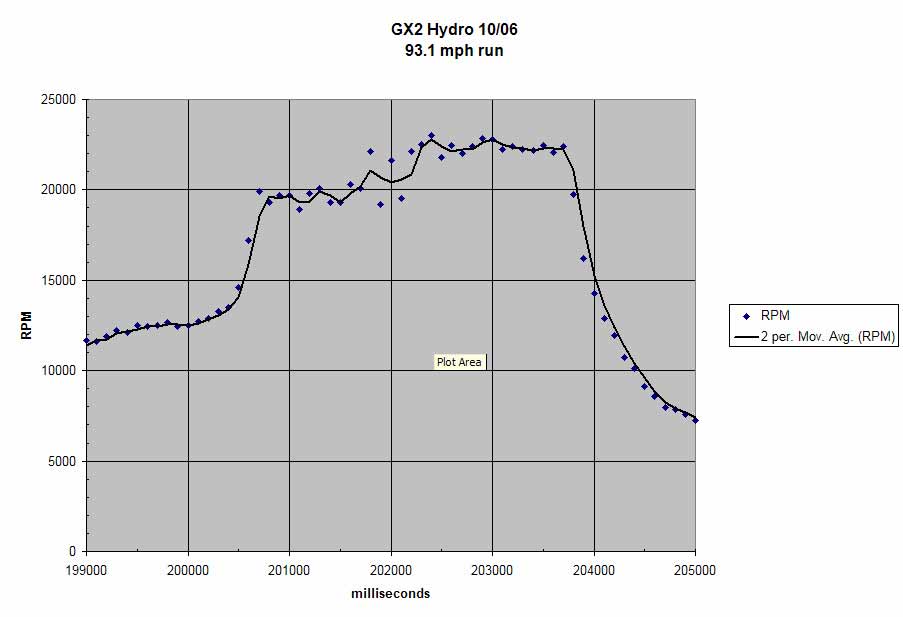
Again it is interesting to see that an inverted stinger doesn’t significantly reduce power and that water injection really helps at lower rpm. Actual testing of the long cone pipe in a boat produced equally interesting results. One graph of rpm versus time is shown below.
The first plateau is reached at 20,000 rpm with the water injection on. Turning the water injection off allows the engine to rev to 23,000 rpm. These rpm readings agree well with the points where the long cone pipe begins to lose power. The space between each vertical line represents one second and the boat is going around 50 mph at 12,000 rpm in this test. It takes much less than ½ second to accelerate to over 80 mph with the water injection on. The rpm remains flat indicating that the boat is not gaining speed after reaching 23,000 rpm. In this case the pipe is governing the maximum rpm and the prop pitch limits the maximum speed. If the second plateau had been sloping up the boat would be still accelerating. It took around four seconds to travel the length of our test pond.
Tuned pipe development can be done with much simpler tools than we used. Data loggers and dynos just make it easier to see things. Given correct inputs, there are several good computer programs that will produce good pipes. Simple speed tests can separate the good from the bad pipes. Remember, props are an important part of the combination. In the example above, the prop didn’t have enough pitch to use all the available power. Engine port timing also interacts with pipe design. A 35cc engine with 150 degree exhaust duration will never rev to 24,000 rpm, no matter what pipe is used.